
Xbox 360
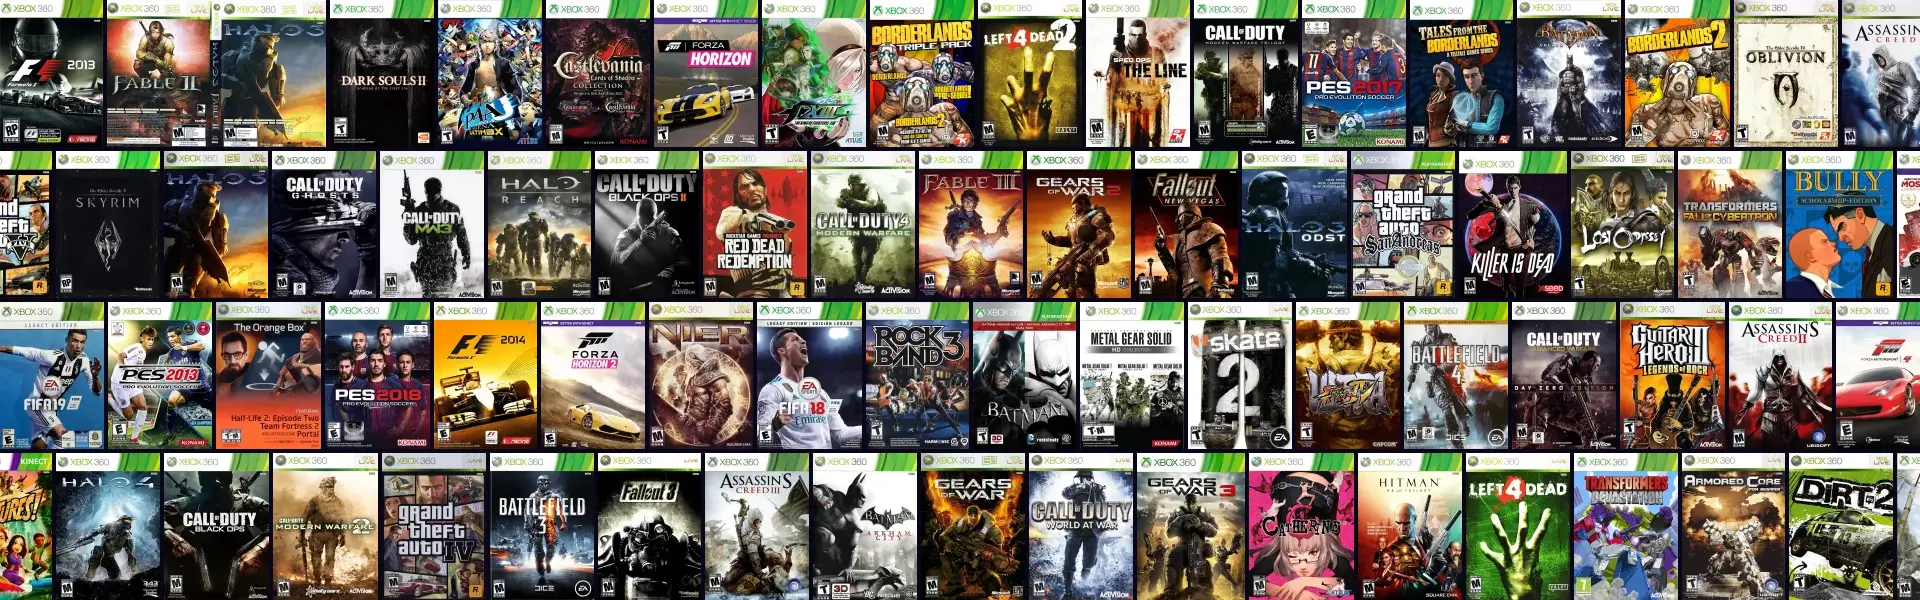
2,047Games
2005-2018YearsRelease Years
Rarity Distribution
34%
Common
(R1–R3)
34%
Common
(R1–R3)
60%
Uncommon
(R4–R5)
60%
Uncommon
(R4–R5)
6%
Rare
(R6–R7)
6%
Rare
(R6–R7)
<1%
Epic+
(R8–R10)
<1%
Epic+
(R8–R10)
Rarity by Release Year
R1
R2
R3
R4
R5
R6
R7
R8
R9
R10
Games
1
5
10
20+
20042006200820102012201420162018
Rarity is increasing
Games from 2014–2018 are 7.9× more likely to be R7+ than 2004–2008.
2018
marks the turning point where higher-rarity games became more common.
Fun Factor vs Rarity
Fun Factor
0255075100
High Fun
Common Games
Common Games
Low Fun
Common Games
Common Games
Low Fun
High Rarity
High Rarity
★ Sweet Spot
High Fun · High Rarity
High Fun · High Rarity
R1 (Common)R3R5R7R9 (Epic)
12%
High Fun (61+)
& Common (R1–R2)
& Common (R1–R2)
12%
High Fun (61+)
& Common (R1–R2)
& Common (R1–R2)
0%
Low Fun (40−)
& Common (R1–R2)
& Common (R1–R2)
0%
Low Fun (40−)
& Common (R1–R2)
& Common (R1–R2)
1%
Low Fun (40−)
& Rare (R6–R9)
& Rare (R6–R9)
1%
Low Fun (40−)
& Rare (R6–R9)
& Rare (R6–R9)
3%
High Fun (61+)
& Rare (R6–R9)
& Rare (R6–R9)
3%
High Fun (61+)
& Rare (R6–R9)
& Rare (R6–R9)
Set Value Over Time
$20K
$13K
$6,636
$0
Aug 14
Aug 21
Aug 28
Sep 4
Sep 11
Sep 18
Sep 25
Oct 2
Oct 9
Oct 16
Today
$10.11K
Loose Set Value
$18.43K
CIB Set Value
Price Distribution
$17.48Average CIB
Price
Price
Price RangeGames
Under $10866 (48%)
$10 - $50852 (47%)
$50 - $10060 (3%)
$100 - $50032 (2%)
$500+0 (0%)
Fun Factor Distribution
91–100
80
81–90
281
71–80
296
61–70
245
51–60
183
41–50
177
31–40
77
21–30
21
11–20
4
1–10
0
075150225300
300
240
180
120
60
0
4
21
77
177
183
245
296
281
80
1–1011–2021–3031–4041–5051–6061–7071–8081–9091–100
67
Avg scoreAverage score
77
Median score
26%
Rated 80+

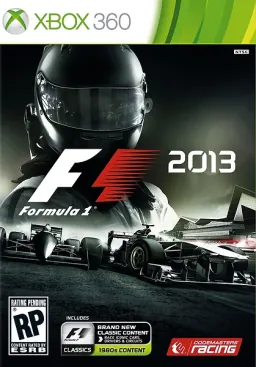


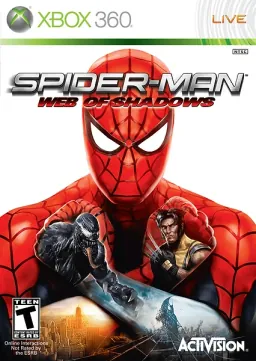
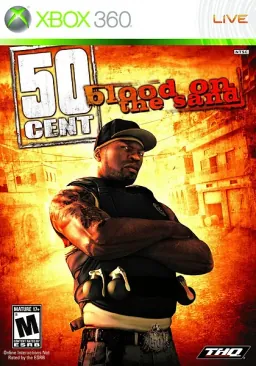
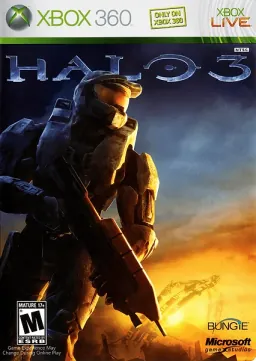
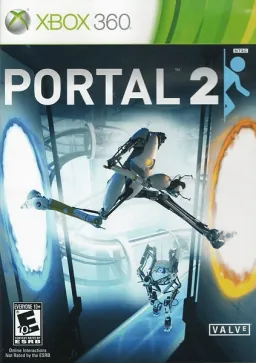
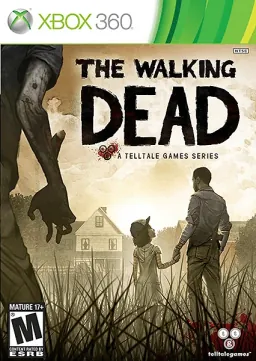
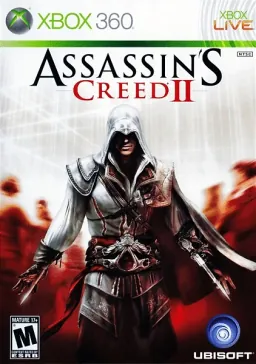
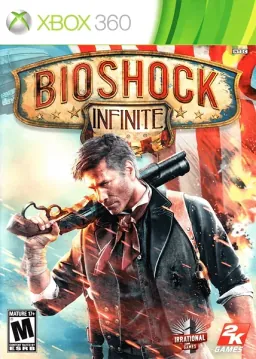
Collector's Report
Value concentration43%
The 10 most valuable games account for 43% of the Xbox 360 library's total value.
See the top 10 →Late-release rarity7.9×
Games released from 2014 on are 7.9× as likely to rank R7 or higher.
Browse late releases →CIB premium+28%
Average CIB value is $17.48, compared with $13.70 loose. $8,328 more across the full library.
Compare values →All values are estimates based on recent market data.